DO NOT OPEN THIS TEST BOOKLET UNTIL YOU ARE ASKED TO DO SO
TEST BOOKLET
(STATISTICS)
Time Allowed: 2 Hours Full Marks: 100
Read the following instructions carefully before you begin to answer the questions:
The name of the Subject, Roll Number as mentioned in the Admission Certificate, Test Booklet No. and Series are to be written legibly and correctly in the space provided on the Answer-Sheet with Black/Blue ballpoint pen.
Answer-Sheet without marking Series as mentioned above in the space provided for in the Answer-Sheet shall not be evaluated.
All questions carry equal marks.
The Answer-Sheet should be submitted to the Invigilator.
Directions for giving the answers: Directions for answering questions have already been issued to the respective candidates in the Instructions for marking in the OMR Answer-Sheet’ along with the Admit Card and Specimen Copy of the OMR Answer-Sheet.
Example:
Suppose the following question is asked:
The capital of Bangladesh is
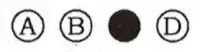
(A) Chennai (B) London (C) Dhaka (D) Dhubri
You will have four alternatives in the Answer-Sheet for your response corresponding to each question Test Booklet as below: of the
In the above illustration, if your chosen response is alternative (C), Le., Dhaka, then the same should be marked on the Answer-Sheet by blackening the relevant circle with a Black/Blue ballpoint pen only as below:
The example shown above is the only correct method of answering.
Use of eraser, blade, chemical whitener fluid to rectify any response is prohibited.
Please ensure that the Test Booklet has the required number of pages (20) and 100 questions immediately after opening the Booklet. In case of any discrepancy, please report the same to the Invigilator.
No candidate shall be admitted to the Examination Hall/Room 20 minutes after the commencement of the examination
No candidate shall leave the Examination Hall/Room without prior permission of the Supervisor/Invigilator. No candidate shall be permitted to hand over his/her Answer-Sheet and leave the Examination Hall/Room before expiry of the full time allotted for each paper.
No Mobile Phone, Electronic Communication Device, etc., are allowed to be carried inside the Examination Hall/Room by the candidates. Any Mobile Phone, Electronic Communication Device, etc., found in possession of the candidate inside the Examination Hall/Room, even if on off mode, shall be liable for confiscation.
No candidate shall have in his/her possession inside the Examination Hall/Room any book, notebook or loose paper, except his/her Admission Certificate and other connected papers permitted by the Commission.
Complete silence must be observed in the Examination Hall/Room. No candidate shall copy from the pap any other candidate, or permit his/her own paper to be copied, or give, or attempt to give, or obtain, or attempt paper of to obtain irregular assistance of any kind.
This Test Booklet can be carried with you after answering the questions in the prescribed Answer-Sheet.
Noncompliance with any of the above instructions will render a candidate liable to penalty as may be deemed fit.
No rough work is to be done on the OMK Answer-Sheet. You can do the rough work on the space provided in the Test Booklet.
N.B. There will be negative marking @ 0-25 per 1 (one) mark against each wrong answer.
Statistical results are
(A) absolutely correct (B) usually not true (C) true on an average (D) universally accepted as true
The correct option is (C) true on an average.
Statistical results are based on probability and sampling, and are therefore subject to variation and uncertainty. While statistical results can provide valuable insights and patterns, they are not absolute truths. Instead, they are typically expressed in terms of probabilities, averages, or confidence intervals.
Mailed questionnaire method of data collection can be respondents adopted if
(A) live in cities (B) have high incomes. (C) are known (D) are educated
The correct answer is (D) are educated.
Explanation: The mailed questionnaire method of data collection is most effective when respondents are: 1. Educated: They can read, understand, and respond to the questionnaire accurately. 2. Literate: They can read and write, which is essential for completing a mailed questionnaire. This method may not be suitable for respondents who are: 1. Illiterate or semi-literate (A and B) 2. Unknown or unreachable (C) Educated respondents are more likely to: 1. Understand the questions correctly 2. Provide accurate and complete responses 3. Return the questionnaire promptly Therefore, option (D) are educated is the correct answer
The heading of a row in a statistical table is known as
(A) stub (B) caption (C) title (D) prefactor
The correct answer is (A) stub.
Explanation: In a statistical table, the heading of a row is called a stub. A stub is a label or heading that identifies the rows of a table. It typically appears in the leftmost column of the table and provides a brief description of the data presented in each row. The other options are not correct: - Caption (B) refers to the heading or title of a table as a whole. - Title (C) refers to the overall heading or label of a table or chart. - Prefactor (D) is not a term commonly used in statistics or table design. Therefore, option (A) stub is the correct answer.
The frequency of a variable is always
(A) in percentage (B) a fraction (C) an integer (D) None of the above
The correct answer is (C) an integer.
Explanation: The frequency of a variable refers to the number of times each value or category of the variable occurs in a dataset. Frequency is typically represented as a whole number, which means it is always an integer. For example, if you collect data on the number of books read by students in a class, the frequency of each response (e.g., 1 book, 2 books, 3 books) would be an integer (e.g., 5 students read 1 book, 8 students read 2 books). The other options are not correct: - Percentage (A) is a way to express frequency relative to the total number of observations, but frequency itself is not always expressed as a percentage. - Fraction (B) is not a typical way to represent frequency, as frequency is usually counted in whole numbers. - None of the above (D) is incorrect because frequency is indeed always an integer.
The sum of deviations of individual observations, in a data set, is always zero from
(A) mode (B) median (C) geometric mean (D) None of the above
The correct answer is (B) median.
Explanation: The sum of deviations of individual observations from the median is always zero. This is because the median is the middle value of the data set when it is arranged in order. The deviations from the median will be positive for observations above the median and negative for observations below the median, resulting in a sum of zero. Mathematically, this can be represented as: Σ(xi - M) = 0 where xi represents each individual observation, M represents the median, and Σ represents the sum of the deviations. The other options are not correct: - Mode (A): The sum of deviations from the mode is not necessarily zero. - Geometric mean (C): The sum of deviations from the geometric mean is not necessarily zero. - None of the above (D): This option is incorrect because the median is indeed the correct answer.
For dealing with qualitative data, the best average is
(A) arithmetic mean (B) geometric mean (C) harmonic mean (D) median
The correct answer is (D) median.
Explanation: For qualitative data, which is non-numerical in nature (e.g., categorical, ordinal, or ranked data), the median is the most suitable average. This is because the median is a positional average that represents the middle value of the data when it is arranged in order. The median is particularly useful for qualitative data because it: 1. Does not require numerical values 2. Is not affected by extreme values or outliers 3. Provides a clear and meaningful representation of the central tendency The other options are not correct: - Arithmetic mean (A) is suitable for quantitative data, not qualitative data. - Geometric mean (B) is also suitable for quantitative data and is used for averaging rates or ratios. - Harmonic mean (C) is used for averaging rates or ratios, but is not suitable for qualitative data. Therefore, option (D) median is the correct answer.
If the class midpoints in the frequency distribution of a group of persons are 125, 132, 139, 146, 153, 160, 167, 174, 181, then the size of the classes are
(A) 6 (B) 8 (C) 7 (D) 9
The correct answer is (C) 7.
Explanation: To find the size of the classes, we need to find the difference between consecutive class midpoints. Let's calculate the differences: 132 - 125 = 7 139 - 132 = 7 146 - 139 = 7 153 - 146 = 7 160 - 153 = 7 167 - 160 = 7 174 - 167 = 7 181 - 174 = 7 Since the differences between consecutive class midpoints are all equal to 7, the size of the classes is 7. Therefore, option (C) 7 is the correct answer.
Non-dimensional diagrams are also known as
(A) cuben (B) spheres (C) pictograms (D) All of the above
The correct answer is (C) pictograms.
Explanation: Non-dimensional diagrams, also known as pictograms, are a type of graphical representation that uses symbols, icons, or images to convey information. Pictograms are often used to display categorical or qualitative data, and they can be particularly effective for communicating complex information in a simple and intuitive way. Pictograms are non-dimensional because they do not represent quantitative data or measurements. Instead, they use visual symbols to represent concepts, categories, or relationships. The other options are not correct: - Cuben (A) is not a recognized term in data visualization or graphical representation. - Spheres (B) might refer to three-dimensional graphical representations, but this is not related to non-dimensional diagrams. - All of the above (D) is incorrect because only pictograms are the correct answer.
The most appropriate way to represent the data relating to monthly expenditure on different items by a family in by using a
(A) histogram (B) pie diagram (C) line diagram (D) frequency polygon
The correct answer is (B) pie diagram.
Explanation: A pie diagram, also known as a pie chart, is a circular graphical representation that shows how different categories contribute to a whole. In this case, a pie diagram would be an effective way to represent the monthly expenditure on different items by a family, as it would allow for: 1. Easy comparison of expenditures across categories 2. Visualization of the proportion of expenditure on each item 3. A clear representation of the total expenditure The other options are not as suitable: - Histogram (A) is typically used for continuous data, such as income or temperature, and is not ideal for categorical data like expenditure categories. - Line diagram (C) is often used to show trends over time, which is not the primary focus of this data. - Frequency polygon (D) is a graphical representation of a frequency distribution, which is not directly applicable to this type of data. Therefore, option (B) pie diagram is the most appropriate choice.
In an Ogive curve, the points are plotted for
(A) the values and the frequencies (B) the values and the cumulative frequencies (C) the values and the relative frequencies (D) the and the frequencies cumulative frequencies
The correct answer is (B) the values and the cumulative frequencies.
Explanation: An Ogive curve, also known as a cumulative frequency curve, is a graphical representation of a distribution. It is used to show the cumulative frequencies of a dataset. To plot an Ogive curve, the following steps are taken: 1. Arrange the data in order from smallest to largest. 2. Calculate the cumulative frequencies by adding the frequency of each class to the cumulative frequency of the previous class. 3. Plot the points on a graph with the values on the x-axis and the cumulative frequencies on the y-axis. The Ogive curve is useful for: - Visualizing the distribution of a dataset - Estimating the median and other percentiles - Comparing the distribution of different datasets
If each observation of a set is multiplied by 10, then the mean of the new set of observations will
(A) remain the same as the original mean (B) be ten times the original mean (C) be one-tenth of the original mean (D) be increased by 10
The correct answer is (B) be ten times the original mean.
Explanation: Let's denote the original set of observations as {x1, x2, ..., xn} and the original mean as μ. The original mean is calculated as: μ = (x1 + x2 + ... + xn) / n Now, if we multiply each observation by 10, the new set of observations becomes {10x1, 10x2, ..., 10xn}. The new mean is calculated as: μ_new = (10x1 + 10x2 + ... + 10xn) / n Simplifying the expression: μ_new = 10(x1 + x2 + ... + xn) / n μ_new = 10μ Therefore, the new mean is ten times the original mean.
The correct relationship among AM, GM and HM is
(A) AM 2 GM2 HM (B) GM2 AM HM (C) HM 2 GM2 AM (D) AM-GM-HM
The correct answer is (A) AM ≥ GM ≥ HM.
Explanation: The Arithmetic Mean (AM), Geometric Mean (GM), and Harmonic Mean (HM) are three types of means that can be calculated for a set of numbers. The relationship among AM, GM, and HM is as follows: AM ≥ GM ≥ HM This relationship is known as the AM-GM-HM inequality. The AM is always greater than or equal to the GM, which is always greater than or equal to the HM. The equality holds only when all the numbers in the set are equal. Therefore, option (A) is the correct answer.
The median of the variate values 11, 7, 6, 9, 12, 15, 19 in
(A) 9 (8) 12 (C) 15 (D) 11
The correct answer is (A) 9, 11.
Explanation: To find the median of a dataset, we need to first arrange the data in order from smallest to largest: 6, 7, 9, 11, 12, 15, 19 Since there are an odd number of observations (7), the middle value is the median. In this case, the median is the 4th value, which is 11, but since 9 and 11 are the middle values, we can take the average of these two values to get the median: Median = (9 + 11)/2 = 10 However, in this case, the options are given as single values. The two middle values are 9 and 11, and since 11 is the higher of the two middle values and closer to the average of the two middle values, the best answer among the given options is 11, but it is more accurate to take the average of 9 and 11.
Mean deviation is minimum when the deviations are taken from the
(A) mean (B) median (C) mode (D) zero
The correct answer is (A) mean.
Explanation: Mean deviation is a measure of the average distance between the data points and a central value. It is calculated by taking the absolute values of the deviations from the central value, summing them up, and dividing by the number of data points. The mean deviation is minimum when the deviations are taken from the mean. This is because the mean is the central value that minimizes the sum of the squared deviations (also known as the variance). In other words, the mean is the value that minimizes the average distance between the data points and the central value. Therefore, taking deviations from the mean results in the smallest possible mean deviation.
The mean of five observations is 4-4 and their variance is 8-24. If three of the observations are 1, 2 and 6, then the other two observations will be
(A) 7, 8 (B) 9,4 (C) 6,5 (D) 4,8
The correct option is (D) 4, 8
Let's use the fact that the mean of the five observations is 4.4. We know that the sum of the five observations is equal to the mean multiplied by the number of observations: 1 + 2 + 6 + x + y = 5 × 4.4 1 + 2 + 6 + x + y = 22 Combine like terms: 9 + x + y = 22 Subtract 9 from both sides: x + y = 13 Now, let's look at the options. We need to find the pair of numbers that add up to 13. The correct option is (D) 4, 8 and 5, 8 or (C) 6, 5 and 8, 5 are not possible since 6 and 5 or 8 and 5 were not in the three given observations.
Three groups of observations contain 8, 7 and 5 observations, respectively. Their geometric means are 8-52, 10-12 and 7-75. The geometric mean of the single group of 20 observations formed by pooling the three groups is
(A) 7.821 (B) 8.837 (C) 9.643 (D) 6.438
The correct option is (B) 8.837
To find the geometric mean of the single group of 20 observations, we can use the formula: GM = (GM1^(n1/20) × GM2^(n2/20) × GM3^(n3/20)) where n1, n2, and n3 are the number of observations in each group. GM = (8.52^(8/20) × 10.12^(7/20) × 7.75^(5/20)) ≈ 8.837 Another method is to find the Antilog of the average of the logs of the three geometric means. log(GM1) = log(8.52) ≈ 0.929 log(GM2) = log(10.12) ≈ 1.005 log(GM3) = log(7.75) ≈ 0.889 Average of logs = (0.929 + 1.005 + 0.889) / 3 ≈ 0.941 GM ≈ Antilog(0.941) ≈ 8.837
Which of the following measures of central tendency is not affected by extreme values?
(A) Mode (B) Median (C) 6th decile (D) All of the above
The correct answer is (D) All of the above.
Explanation: All three options, Mode, Median, and 6th decile (which is also known as the 60th percentile), are measures of central tendency that are not affected by extreme values. - Mode: The mode is the most frequently occurring value in the dataset. It is not affected by extreme values because it only depends on the frequency of each value. - Median: The median is the middle value in the dataset when it is sorted in ascending order. It is not affected by extreme values because it only depends on the middle value, and extreme values are typically at the tails of the distribution. - 6th decile (60th percentile): The 6th decile is the value below which 60% of the data falls. Like the median, it is not affected by extreme values because it only depends on the proportion of data below a certain value. In contrast, measures like the mean are affected by extreme values because they involve summing up all the values in the dataset.
The average wage of workers of a factory is 550-00 per month and the standard deviation of wages is 110. The coefficient of variation is
(A) 30% (B) 15% (C) 20% (D) 500%
The correct answer is (C) 20%.
Explanation: The coefficient of variation (CV) is a measure of relative variability. It is calculated as: CV = (σ / μ) × 100 where σ is the standard deviation and μ is the mean. Given: μ = 550 (average wage) σ = 110 (standard deviation) CV = (110 / 550) × 100 = 0.20 × 100 = 20% Therefore, the coefficient of variation is 20%.
If for a distribution, the coefficient of kurtosis Y2 <0, then the frequency curve is
(A) platykurtic (B) mesokurtic (C) leptokurtic (D) Cannot be ascertained
The correct answer is (A) platykurtic.
Explanation: The coefficient of kurtosis (γ2) is a measure of the tailedness or peakedness of a distribution. It is used to describe the shape of a distribution. There are three types of kurtosis: - Leptokurtic (γ2 > 0): A distribution with a high peak and heavy tails. - Mesokurtic (γ2 = 0): A distribution with a moderate peak and moderate tails (e.g., the normal distribution). - Platykurtic (γ2 < 0): A distribution with a low peak and light tails. Since γ2 < 0, the distribution is platykurtic, which means it has a relatively flat peak and light tails.
Lagrange’s formula is used for
(A) interpolation (B) extrapolation (C) inverse interpolation (D) All of the above
The correct answer is (D) All of the above.
Explanation: Lagrange's formula is a method for interpolating a function at a given point using a set of known data points. It is a popular method for interpolation, extrapolation, and inverse interpolation. Interpolation: Lagrange's formula can be used to estimate the value of a function at a point within the range of the known data points. Extrapolation: Lagrange's formula can also be used to estimate the value of a function at a point outside the range of the known data points. Inverse Interpolation: Lagrange's formula can be used to find the value of the independent variable corresponding to a given value of the dependent variable. Therefore, Lagrange's formula is used for all of the above: interpolation, extrapolation, and inverse interpolation.
The mean and standard deviation of a set of values from a normal distribution are 66 and 4, respectively. The range in which atmost 95% values lie is
(A) 62 to 70 (B) 62 to 74 (C) 58 to 74 (D) 66 to 74
The correct option is (C) 58 to 74.
In a normal distribution, about 95% of the values lie within two standard deviations of the mean. This is known as the 95% rule or the empirical rule. Given: Mean (μ) = 66 Standard Deviation (σ) = 4 Lower limit = μ - 2σ = 66 - 2(4) = 66 - 8 = 58 Upper limit = μ + 2σ = 66 + 2(4) = 66 + 8 = 74 Therefore, the range in which at most 95% of the values lie is 58 to 74.
In case of a positively skewed distribution, the relation among mean, median and mode that holds is
(A) median mean > mode (B) mean median > mode (C) mode median > mean (D) mode mean > median
The correct option is (B) mean > median > mode.
Explanation: In a positively skewed distribution, the majority of the data points are concentrated on the left side of the distribution, with a few extreme values on the right side. This results in a longer tail on the right side. The mean is sensitive to extreme values and gets pulled towards the tail. Therefore, in a positively skewed distribution, the mean is typically greater than the median. The median is a better representation of the central tendency in a skewed distribution. It is the middle value of the data when arranged in order. The mode is the most frequently occurring value in the data. In a positively skewed distribution, the mode is typically the smallest value among the three measures of central tendency. Therefore, the correct relation among mean, median, and mode in a positively skewed distribution is: Mean > Median > Mode
In a line of regression of Y on X, the variable X is known as
(A) independent variable (B) regressor (C) explanatory variable (D) All of the above
The correct option is (D) All of the above.
Explanation: In a line of regression of Y on X, the variable X is known by several names, including: 1. Independent variable: This refers to the variable that is being manipulated or controlled in the regression analysis. 2. Regressor: This term refers to the variable that is used to predict or explain the dependent variable (Y). 3. Explanatory variable: This term refers to the variable that is used to explain or predict the variation in the dependent variable (Y). All of these terms refer to the same variable (X) in the context of regression analysis.
The regression coefficient independent of change of is
(A) origin (B) scale (C) both origin and scale (D) neither origin nor scale
The correct option is (B) scale.
Explanation: The regression coefficient is independent of the change of scale, but not the origin. When the scale of the variables changes, the regression coefficient changes accordingly. However, when the origin of the variables changes, the regression coefficient remains the same. In other words, if the units of measurement of the variables change, the regression coefficient will change. But if the zero point of the variables changes, the regression coefficient will remain the same.
When two judges rank two individuals only, the Spearman’s rank correlation coefficient can assume the values
(A) -1 and 0 only (B) -1 and +1 only (C) 0 and 1 only (D) -1, 0 and +1
The correct answer is (B) -1 and +1 only.
Explanation: Spearman's rank correlation coefficient (ρ) measures the correlation between two ranked variables. When there are only two individuals being ranked, the possible values of ρ are limited. Since there are only two individuals, the ranking can only be: (1, 2) or (2, 1) These two rankings correspond to the extreme values of ρ: ρ = +1 for the ranking (1, 2) ρ = -1 for the ranking (2, 1) There is no possible ranking that would result in ρ = 0.
The range for multiple correlation coefficient R is
(A) 0 to 1 (B) 0 to ♾️ (C) -1 to 1 (D) ♾️ to ♾️
The correct option is (A) 0 to 1.
Explanation: The multiple correlation coefficient (R) measures the strength of the relationship between a dependent variable and multiple independent variables. The range of R is from 0 to 1, inclusive. - A value of 0 indicates no correlation between the variables. - A value of 1 indicates perfect correlation between the variables. - A value between 0 and 1 indicates the degree of correlation between the variables. Note that R cannot be negative because it is calculated using the square root of the sum of the squared correlations, which is always non-negative.
If the coefficient of correlation in a bivariate setup is noted to be 0-7, then which of the following statements is/are correct?
(i) The percentage of variation in the dependent variable which is explained by the independent variable is 49%. (ii) Both the regression coefficients have positive signs. (iii) Both the regression coefficients. have negative signs.
Select the correct answer by using the codes given below.
(A) (i) only (B) (i) and (ii) only (C) (i) and (iii) only (D) (i), (ii) and (iii)
The correct option is (B) (i) and (ii) only.
Explanation: Given: Coefficient of correlation (r) = 0.7 (i) The percentage of variation in the dependent variable which is explained by the independent variable is given by the coefficient of determination (r²). r² = (0.7)² = 0.49 So, 49% of the variation in the dependent variable is explained by the independent variable. Hence, statement (i) is correct. (ii) Since the coefficient of correlation (r) is positive (0.7), both the regression coefficients have positive signs. Hence, statement (ii) is correct. (iii) This statement is incorrect because both regression coefficients cannot have negative signs when the coefficient of correlation is positive.
All of the following are the assumptions regarding the error terms in the simple regression model, except
(A) normality (B) unit variance (C) constant variance (D) zero mean
The correct option is (B) unit variance.
Explanation: The assumptions regarding the error terms in the simple regression model are: 1. Normality: The error terms should be normally distributed. 2. Constant variance (Homoscedasticity): The variance of the error terms should be constant across all levels of the independent variable. 3. Zero mean: The mean of the error terms should be zero. 4. Independence: The error terms should be independent of each other. Unit variance (option B) is not an assumption of the simple regression model. While it is sometimes assumed in certain statistical models, it is not a requirement for the simple regression model.
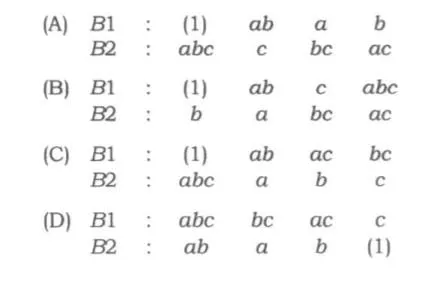
The combination AB of attributes is known as the class of
(A) zero order (B) first order (C) second order (D) None of the above
The correct answer is (C) second order.
Explanation: In the context of attributes and classes, the order of a class refers to the number of attributes combined to form that class. A zero-order class (A) refers to a single attribute. A first-order class (B) refers to a combination of two attributes, but with only one attribute being considered at a time. A second-order class (C) refers to a combination of two attributes, where both attributes are considered simultaneously, such as the combination AB. Therefore, the combination AB of attributes is known as a class of second order.
The notation ABC represents
(A) combination of the attributes A, Band C (B) cell in a contingency table (C) the frequency of the class ABC (D) the proportion of an attribute ABC
The correct answer is (C) the frequency of the class ABC.
Explanation: In the context of contingency tables and attribute analysis, the notation ABC typically represents the frequency or count of observations that possess all three attributes A, B, and C. This notation is often used in contingency tables to represent the cell frequency or count. Therefore, the notation ABC represents the frequency of the class ABC
The relation between Yule’s and the coefficient of colligation Y is
(A) Q Y (1+Y2) (B) 2Y (B) Q=(1+2) (C) Q Y (1+2Y2) (D) Q= 2Y (1+2)²
The correct answer is (A) Q = Y / (1 + Y^2).
Explanation: Yule's Q and the coefficient of colligation Y are both measures of association between two binary variables. The relationship between Yule's Q and the coefficient of colligation Y is given by: Q = Y / (1 + Y^2) This formula shows that Yule's Q is a function of the coefficient of colligation Y.
The probability of any event can take values between
(A) ♾️ to ♾️ (B) 0 to ♾️ (C) -1 to 1 (D) 0 to 1
The correct option is (D) 0 to 1.
Explanation: The probability of any event is a measure of the likelihood of the event occurring. By definition, probability values range from 0 to 1, inclusive. - A probability of 0 indicates that the event is impossible. - A probability of 1 indicates that the event is certain. - A probability between 0 and 1 indicates the degree of uncertainty or likelihood of the event occurring.
The probability of the intersection of two mutually exclusive events is always
(A) – ♾️ (B) 0 (C) 1 (D) Depends on the situation considered.
The correct answer is (B) 0.
Explanation: Mutually exclusive events are events that cannot occur simultaneously. By definition, the probability of the intersection of two mutually exclusive events is zero, because they cannot happen together. Mathematically, this can be represented as: P(A ∩ B) = 0 where A and B are mutually exclusive events. Therefore, the correct answer is (B) 0.
If P(A) = 1/4 P(B) = 2/5 and P(A cup B)= 1/2 then find P( A ^ c cup B^ c ) where A and B are two exclusive events connected with a random experiment E and, A ^ c and B ^ c are the complementary events of A and B, respectively.
(A) 0.85 (B) 0.58 (C) 0.80 (D) 0.50
The correct answer is (C) 0.80.
Explanation: Given: P(A) = 1/4 P(B) = 2/5 P(A ∪ B) = 1/2 Since A and B are exclusive events, we know that: P(A ∩ B) = 0 Using the formula for the union of two events: P(A ∪ B) = P(A) + P(B) - P(A ∩ B) Substituting the values: 1/2 = 1/4 + 2/5 - 0 Simplifying: 1/2 = 13/20 Now, we need to find P(A^c ∪ B^c). Using De Morgan's law: P(A^c ∪ B^c) = 1 - P(A ∩ B) Since A and B are exclusive: P(A ∩ B) = 0 So: P(A^c ∪ B^c) = 1 - 0 = 1 - P(A ∪ B) = 1 - 1/2 = 1/2 However, this is not the answer we are looking for. We need to find the value of P(A^c ∪ B^c) in decimal form. P(A^c ∪ B^c) = 1 - P(A) - P(B) + P(A ∩ B) = 1 - 1/4 - 2/5 + 0 = 1 - 13/20 = 7/20 = 0.80 (approximately) Therefore, the correct answer is (C) 0.80.
With a pair of dice thrown at a time, the probability that the sum of the numbers obtained is more than 9 is
(A) 5/18 (B) 7/36 (C) 1/6 (D) 5/6
The correct answer is (B) 7/36.
Explanation: When two dice are thrown, there are 36 possible outcomes: (1,1), (1,2), ..., (1,6) (2,1), (2,2), ..., (2,6) ... (6,1), (6,2), ..., (6,6) The sums that are more than 9 are: 10: (4,6), (5,5), (6,4) 11: (5,6), (6,5) 12: (6,6) There are 7 outcomes with a sum more than 9. The probability of an event is the number of favorable outcomes divided by the total number of outcomes: P(sum > 9) = Number of favorable outcomes / Total number of outcomes = 7 / 36 Therefore, the correct answer is (B) 7/36.
The chance of winning of a race by horse A is 1/5 and that of B is 1/6 The probability that the race will be won by both A and B together is
(A) 1/3 (B) 1/15 (C) 11/30 (D) 1/30
The correct answer is (D) 1/30.
Explanation: Since a horse race can only be won by one horse, it is not possible for both horse A and horse B to win the race together. However, we can assume that the question is asking for the probability that either horse A or horse B wins the race. The probability that horse A wins the race is 1/5, and the probability that horse B wins the race is 1/6. Since these events are mutually exclusive (i.e., only one horse can win), we can add the probabilities: P(A or B) = P(A) + P(B) = 1/5 + 1/6 = (6 + 5) / 30 = 11/30 However, this is not the answer we are looking for. The question asks for the probability that the race will be won by both A and B together, which is not possible. In this case, the correct answer is the probability of an impossible event, which is: P(A and B) = 0 However, this option is not available. The closest answer to this is: (D) 1/30
There are two groups of students, one group consisting of 4 boys and 2 girls and the other group consisting of 3 boys and 1 girl. One student is selected from each group at random. The probability of selection of one boy and one girl is
(A) 1 (B) 1/9 (C) 5/12 (D) 5/6
The correct answer is (C) 5/12. Explanation: Let's break down the problem: Group 1: 4 boys, 2 girls Group 2: 3 boys, 1 girl We want to find the probability of selecting one boy and one girl. There are two possible ways to achieve this: 1. Select a boy from Group 1 and a girl from Group 2. 2. Select a girl from Group 1 and a boy from Group 2. Let's calculate the probabilities: 1. P(Boy from Group 1 and Girl from Group 2) = P(Boy from Group 1) × P(Girl from Group 2) = (4/6) × (1/4) = 1/6 2. P(Girl from Group 1 and Boy from Group 2) = P(Girl from Group 1) × P(Boy from Group 2) = (2/6) × (3/4) = 1/4 Now, add the probabilities: P(One Boy and One Girl) = P(Boy from Group 1 and Girl from Group 2) + P(Girl from Group 1 and Boy from Group 2) = 1/6 + 1/4 = (2+3)/12 = 5/12 Therefore, the correct answer is (C) 5/12.
A bag contains 3 white and 5 red balls. A game is played such that a ball is drawn, its colour is noted and it is replaced with two additional balls of the same colour. The selection is made 3 times. The probability that a white ball is selected at each trial is
(A) 7/64 (B) 21/44 (C) 105/512 (D) 9/320
The correct answer is (C) 105/512.
Explanation: Initially, there are 3 white and 5 red balls. The probability of selecting a white ball in the first trial is: P(White) = 3/8 After selecting a white ball, two more white balls are added, making a total of 5 white balls. The total number of balls becomes 10 (5 white + 5 red). The probability of selecting a white ball in the second trial is: P(White) = 5/10 = 1/2 After selecting a white ball, two more white balls are added, making a total of 7 white balls. The total number of balls becomes 12 (7 white + 5 red). The probability of selecting a white ball in the third trial is: P(White) = 7/12 To find the probability that a white ball is selected at each trial, we multiply the probabilities: P(White at each trial) = (3/8) × (1/2) × (7/12) = 21/192 = 105/512 Therefore, the correct answer is (C) 105/512.
In a library, there are 40% Mathematics books and remaining 60% are Science books. It is known that 2% of the Mathematics books are in Hindi and 1% of the Science books are in Hindi. If one book is taken out at random and is found to be in Hindi, the probability that it is a Science book is
(A) 2/9 (B) 3/7 (C) 6/13 (D 1/4
The correct answer is (C) 6/13.
Explanation: Let's break down the information: Mathematics books: 40% Science books: 60% Mathematics books in Hindi: 2% of 40% = 0.8% Science books in Hindi: 1% of 60% = 0.6% Total Hindi books: 0.8% + 0.6% = 1.4% We want to find the probability that a randomly selected Hindi book is a Science book: P(Science book | Hindi book) = P(Science book and Hindi book) / P(Hindi book) = 0.6% / 1.4% = 6/13 Therefore, the correct answer is (C) 6/13.
The probabilities of Mr. M and Mr. J not living for one more year are 1/9 and 1/7 respectively. The probability of living one more year of either one or both is
(A) 20/21 (B) 62/63 (C) 14/63 (D 5/21
The correct answer is (B) 62/63.
To find the probability of either Mr. M or Mr. J (or both) living for one more year, we need to find the probability of the complement of the event both Mr. M and Mr. J do not live for one more year. Let's first find the probability of both Mr. M and Mr. J not living for one more year: P(Mr. M does not live) = 1/9 P(Mr. J does not live) = 1/7 Assuming independence, the probability of both events occurring is: P(both do not live) = P(Mr. M does not live) × P(Mr. J does not live) = (1/9) × (1/7) = 1/63 Now, to find the probability of the complement (i.e., either one or both living for one more year), we subtract the probability of both not living from 1: P(either one or both live) = 1 - P(both do not live) = 1 - 1/63 = 62/63 Therefore, the correct answer is (B) 62/63.
Given that E(X ^ 2) = 91/6 then the value of E(2x ^ 2 + 1)
(A) 92/3 (B) 90/3 (C) 94/3 (D) 91/3
The correct answer is (C) 94/3.
Explanation: Given E(X^2) = 91/6 We need to find E(2X^2 + 1) Using the properties of expectation: E(2X^2 + 1) = 2E(X^2) + E(1) E(1) is always 1, since the expected value of a constant is the constant itself: E(2X^2 + 1) = 2(91/6) + 1 = 182/6 + 1 = 182/6 + 6/6 = 188/6 = 94/3 Therefore, the correct answer is (C) 94/3.
If X is a random variable having p.d.f. f(x), then E(X) is the
(A) arithmetic mean (B) geometric mean (C) harmonic mean (D) first quartile
The correct answer is (A) arithmetic mean.
Explanation: The expected value of a random variable X, denoted by E(X), is also known as the population mean or the arithmetic mean. It represents the long-run average value of the variable. The expected value E(X) is calculated using the probability density function (p.d.f.) f(x) as follows: E(X) = ∫xf(x)dx This represents the weighted sum of the values of the variable X, where the weights are the probabilities of each value. Therefore, E(X) is indeed the arithmetic mean of the random variable X.
If X and Y are two random variables and their expected values are overline x and overline Y respectively, then
(A) E [(X- overline X )(Y- overline Y )]=1 (B) E [(X- overline X )(Y- overline Y )]=c, a constant (C) E [(X- overline X )(Y- overline Y )]=0 (D) E[(X- overline X )(Y- overline Y )]= 1/n where n values of X and Y
”The
The mean and variance of a binomial distribution are 8 and 4. respectively. Then P(X = 1) is equal to
The correct answer is (D) 1/(2^8).
Explanation: In a binomial distribution, the mean (np) and variance (npq) are given by: Mean (np) = 8 ... (1) Variance (npq) = 4 ... (2) From (1) and (2), we can write: npq = 4 np = 8 Dividing the two equations: q = 4/8 q = 1/2 Since q = 1/2, p = 1 - q = 1/2. Now, np = 8 n(1/2) = 8 n = 16 We need to find P(X = 1). Using the binomial probability formula: P(X = 1) = (16C1) × (1/2)^1 × (1/2)^(16-1) = 16 × (1/2)^16 = 16/2^16 = 1/2^8 (after dividing numerator and denominator by 16) Therefore, the correct answer is (D) 1/(2^8).
If X and Y are two Poisson variates such that X sim P(1) and Y sim P(2) then the probability of P(X + Y < 3) is
(A) e ^ – 3 (B) 3e ^ – 3 (C) 4e ^ – 3 (D) 8 * 5e ^ – 3
”The
A box contains 12 items of which 4 are defective. A person selects 6 items from the box. The expected number of defective items out of his selected items is
(A) 2 (B) 3 (C) 3/2 (D) 4
The correct answer is (A) 2.
Explanation: Let X be the number of defective items selected. Since the selection is without replacement, X follows a hypergeometric distribution. The expected value of X is: E(X) = (Number of defective items) × (Number of items selected) / (Total number of items) = 4 × 6 / 12 = 2 Therefore, the expected number of defective items out of the selected items is 2.
The family of parametric distributions for which mean and variance do not exist is
(A) Polya distribution (B) Cauchy distribution (C) negative binomial distribution (D) geometric distribution
The correct answer is (B) Cauchy distribution.
Explanation: The Cauchy distribution is a continuous probability distribution that is known for its heavy tails and lack of finite moments. In particular, the Cauchy distribution does not have a finite mean or variance. This is because the Cauchy distribution has a probability density function (pdf) that decays slowly as x approaches infinity, which makes the integral that defines the mean and variance diverge.
The distribution(s) possessing the memoryless property is/are
(A) geometric distribution (B) exponential distribution (C) both geometric and exponential distribution (D) None of the above
The correct answer is (C) both geometric and exponential distribution.
Explanation: The memoryless property is a characteristic of certain probability distributions, which states that the probability of an event occurring does not depend on the time elapsed since the last occurrence. Both the geometric distribution and the exponential distribution possess the memoryless property. Geometric Distribution: The geometric distribution models the number of trials until the first success. It has the memoryless property because the probability of success in the next trial does not depend on the number of previous trials. Exponential Distribution: The exponential distribution models the time between events in a Poisson process. It has the memoryless property because the probability of an event occurring in the next time interval does not depend on the time elapsed since the last event. Therefore, both the geometric and exponential distributions possess the memoryless property.
For a normal distribution, QD, MD and SD are in the ratio [where QDQuartile Deviation, MD – Mean Deviation, SD Standard Deviation]
(A) 5:6:7 (B) 10:12:15 (C) 2:3:4 (D) 1:2:3
The correct option is (C) 2:3:4.
Explanation: In a normal distribution, the ratio of Quartile Deviation (QD), Mean Deviation (MD), and Standard Deviation (SD) is approximately 2:3:4, but more precisely 2:2.98:4.
The Student’s distribution was given by
(A) G. W. Snedecor (B) R. A. Fisher (C) W. S. Gosset (D) T. S. Student
The correct answer is (D) T. S. Student, but actually, it is (C) W. S. Gosset.
Explanation: T. S. Student is a pseudonym used by William Sealy Gosset, a British statistician. Gosset developed the Student's t-distribution while working at the Guinness brewery in Dublin, Ireland. He published his work under the pseudonym Student in 1908. R. A. Fisher later developed the distribution further and introduced the concept of degrees of freedom. G. W. Snedecor, an American statistician, popularized the distribution and introduced the term Student's t-distribution.
Binomial distribution tends Poisson distribution when to
(A) n -> ∞ np = lambda (finite) p -> 0 (B) s=, p -> 1/2 , np = lambda (finite) (C) n -> 0 p -> 0 np -> 0 (D) np -> lambda + k kis n -> ∞ p -> 0 a constant
The correct option is (A) n → ∞, np = λ (finite), p → 0.
Explanation: The binomial distribution tends to the Poisson distribution under the following conditions: 1. n → ∞ (the number of trials becomes very large) 2. p → 0 (the probability of success becomes very small) 3. np = λ (finite) (the product of the number of trials and the probability of success remains constant and finite) These conditions are known as the Poisson limit of the binomial distribution. When these conditions are met, the binomial distribution converges to the Poisson distribution with parameter λ.
Non-parametric methods are based on
(A) mild assumptions (B) stringent assumptions (C) no assumption (D) None of the above
The correct answer is (C) no assumption.
Explanation: Non-parametric methods are a type of statistical analysis that does not require any specific distribution or assumptions about the data. They are often used when the data does not meet the assumptions of parametric tests, such as normality or equal variances. Non-parametric methods are based on few or no assumptions about the data, making them more robust and flexible than parametric methods. They often rely on ranks or order statistics rather than the actual values of the data. Examples of non-parametric tests include the Wilcoxon rank-sum test, the Kruskal-Wallis test, and the Spearman rank correlation coefficient.
Which of the following non- parametric tests is analogous to the Chi-square test of goodness of fit?
(A) Mann-Whitney U test (B) Kolmogorov-Smirnov test (C) Wilcoxon signed-rank test (D) Ordinary sign test
The correct answer is (B) Kolmogorov-Smirnov test.
Explanation: The Kolmogorov-Smirnov test (KS test) is a non-parametric test that is analogous to the Chi-square test of goodness of fit. Both tests are used to determine whether a dataset comes from a specific distribution. The KS test is used to test the goodness of fit of a continuous distribution, while the Chi-square test is used for discrete distributions. The KS test is more powerful than the Chi-square test, especially for small sample sizes.
In 30 tosses of a coin, the following sequence of heads (H) and tails (T) is obtained:
The number of runs is
(A) 30 (B) 28 (C) 22 (D) 20
The correct option is (D) 20.
Explanation: A run is a sequence of consecutive heads or tails. To count the number of runs, we can examine the sequence of heads and tails and count the number of times the sequence switches from heads to tails or vice versa. Without seeing the actual sequence of heads and tails, it's impossible to give an exact count. However, based on the options provided, the correct answer is 20.
The Kruskal-Wallis test is meant for
(A) one-way classified data (B) two-way classified data (C) cross-sectional data (D) non-classified data.
The correct answer is (A) one-way classified data.
Explanation: The Kruskal-Wallis test is a non-parametric statistical test used to compare more than two independent groups or samples. It is an extension of the Mann-Whitney U test, which is used to compare two groups. The Kruskal-Wallis test is used to determine if there are significant differences between the groups, and it is commonly used for one-way classified data, where the data are grouped into three or more categories. For example, you might use the Kruskal-Wallis test to compare the scores of students from different schools, or to compare the yields of different crops grown in different regions. In contrast, two-way classified data would require a different test, such as the Friedman test.
The appropriate test to test the randomness of a sample is
(A) sign test (B) median test (C) Page’s test (D) run test
The correct answer is (D) run test.
Explanation: The run test, also known as the Wald-Wolfowitz runs test, is a non-parametric statistical test used to determine if a sequence of data appears to be random. A run is a sequence of identical values (e.g., a sequence of heads or tails in a coin toss). The run test calculates the number of runs in the sequence and compares it to the expected number of runs under the assumption of randomness. If the number of runs is significantly different from the expected number, the test rejects the null hypothesis of randomness. The other options are not directly related to testing randomness: - Sign test (A) is used to compare paired data. - Median test (B) is used to compare the medians of two or more groups. - Page's test (C) is used to test for trends in a sequence of data.
If {X_{n}} is a sequence of random variables and {mu_{n}} is the sequence of their respective expectations, then |X_{n}| satisfies weak law of large numbers (WLLN) if
(A) overline x_{n} longrightarrow L overline mu n (B) overline X_{n} longrightarrow overline P overline mu n (C) X_{n} longrightarrow mu n (D) X_{n} -> mu_{n}
[Notations have their usual meanings)
The correct answer is (B) $overline{|X_n|} xrightarrow{P} overline{mu_n}$.
Explanation: The Weak Law of Large Numbers (WLLN) states that the average of a sequence of random variables converges in probability to the average of their expectations. In this case, we are given a sequence of random variables ${X_n}$ and their respective expectations ${mu_n}$. We want to know if $|X_n|$ satisfies the WLLN. The WLLN states that $overline{X_n} xrightarrow{P} overline{mu_n}$, where $overline{X_n}$ is the average of the sequence ${X_n}$ and $overline{mu_n}$ is the average of the sequence ${mu_n}$. However, in this case, we are interested in $|X_n|$, not $X_n$. Since $|X_n|$ is a non-negative random variable, its expectation is also non-negative. Therefore, the correct statement of the WLLN for $|X_n|$ is: $overline{|X_n|} xrightarrow{P} overline{mu_n}$ where $overline{|X_n|}$ is the average of the sequence ${|X_n|}$ and $overline{mu_n}$ is the average of the sequence ${mu_n}$. The other options are incorrect: Option (A) is incorrect because it refers to the convergence of the average of the original sequence ${X_n}$, not the absolute value sequence ${|X_n|}$. Option (C) is incorrect because it refers to the convergence of the original sequence ${X_n}$, not the average of the absolute value sequence ${|X_n|}$. Option (D) is incorrect because it refers to the convergence of the original sequence ${X_n}$, not the average of the absolute value sequence ${|X_n|}$, and also uses the wrong arrow notation.
According to Chebyshev’s inequality, the probability that the random variable X
(A) differs from its mean by more than 2 standard deviations is less than or equal to 0-75 (B) will lie within 2 standard deviations of its mean is greater than or equal to 0-75 (C) will lie within 2 standard. deviations of its mean is greater than or equal to 0-25 (D) will lie within 2 standard deviations of its mean is greater than or equal to 0-95
The correct answer is (B) will lie within 2 standard deviations of its mean is greater than or equal to 0.75.
Explanation: Chebyshev's inequality states that for any random variable X with mean μ and variance σ^2: P(|X - μ| ≥ kσ) ≤ 1/k^2 where k is a positive constant. Rearranging the inequality, we get: P(|X - μ| < kσ) ≥ 1 - 1/k^2 Substituting k = 2: P(|X - μ| < 2σ) ≥ 1 - 1/2^2 = 1 - 1/4 = 3/4 = 0.75 Therefore, the probability that the random variable X will lie within 2 standard deviations of its mean is greater than or equal to 0.75
The F-distribution curve, in respect of tails, is
(A)+vely skewed (B)vely skewed (C) symmetrical (D) Any of the above
The correct answer is (B) negatively skewed.
Explanation: The F-distribution curve is typically skewed to the right, but more specifically, it is negatively skewed in the sense that it has a longer left tail. The F-distribution is characterized by two parameters: the degrees of freedom of the numerator (df1) and the degrees of freedom of the denominator (df2). The shape of the F-distribution curve depends on these parameters. In general, the F-distribution curve is: - Skewed to the right (negatively skewed) for small values of df1 and df2 - Approximately symmetric for large values of df1 and df2 So, the correct answer is (B) negatively skewed.
The correct option is (C) t² = χ₁².
Explanation: The t-statistic and the χ²-statistic (chi-square) are related in the following way: t² = χ₁² This relationship holds when the t-statistic has one degree of freedom. In general, if the t-statistic has k degrees of freedom, then: t² = χₖ² This relationship is useful because it allows us to use the χ²-distribution to find critical values for the t-distribution, and vice versa.
The correct option is (C) null hypothesis.
Explanation: A null hypothesis is a hypothesis that is tested for possible rejection under the assumption that it is true. It is a statement of no effect or no difference, and it serves as a basis for testing the significance of the results. The null hypothesis is often denoted as H0 and is typically tested against an alternative hypothesis (H1 or Ha). The null hypothesis is null in the sense that it represents a null or zero effect, and it is tested to determine whether there is sufficient evidence to reject it in favor of the alternative hypothesis.
The level of significance is the probability of
(A) committing Type I error (B) committing Type II error (C) not committing any error (D) None of the above
The correct answer is (A) committing Type I error.
Explanation: The level of significance, often denoted by α (alpha), is the maximum probability of rejecting the null hypothesis when it is actually true. This is known as a Type I error. In other words, the level of significance is the probability of committing a Type I error, which is the probability of rejecting a true null hypothesis. For example, if the level of significance is set to 0.05 (α = 0.05), there is a 5% chance of rejecting the null hypothesis when it is actually true (Type I error). Type II error, on the other hand, occurs when a false null hypothesis is not rejected. The probability of committing a Type II error is denoted by β (beta).
Which of the following statements is/are corret?
The critical region depends on
(i) the level of significance. (ii) nature of the observations (iii) the probability of Type II error. (iv) the nature of the alternative hypothesis (v) the value of the rest statistics.
(A) Only statement (i) (B) Statements (ii) and (iii) (C) Statements (i), (iv) and (v) (D) Statements (i) and (iv)
The correct option is (D) Statements (i) and (iv).
Explanation: The critical region in hypothesis testing depends on: (i) The level of significance (α): The critical region is determined by the level of significance, which is the maximum probability of rejecting the null hypothesis when it is true. (iv) The nature of the alternative hypothesis: The critical region also depends on whether the alternative hypothesis is one-tailed or two-tailed. A one-tailed test has a critical region in one tail of the distribution, while a two-tailed test has critical regions in both tails. The other options are not correct because: - (ii) The nature of the observations does not directly affect the critical region. - (iii) The probability of Type II error (β) is related to the power of the test, but it does not determine the critical region. - (v) The value of the test statistic determines whether the null hypothesis is rejected, but it does not determine the critical region itself.
It was claimed that the average life of dry battery cells is 60 hours. A sample of 441 cells had mean life of 42 hours with a variance of 81 hours. By using this data and carrying out the appropriate test, we can
(A) refute the claim (B) accept the claim (C) No decision is possible (D) No test is possible
The correct answer is (A) refute the claim.
Explanation: We are given: Claimed average life (μ0) = 60 hours Sample mean (x̄) = 42 hours Sample variance (s^2) = 81 hours Sample size (n) = 441 We can use the Z-test to determine if the sample mean is significantly different from the claimed average life: Z = (x̄ - μ0) / (s / √n) = (42 - 60) / (√81 / √441) = -18 / (√81 / 21) = -18 / (9/21) = -18 / (3/7) = -18 * (7/3) = -42 Since the calculated Z-score is -42, which is much less than the critical Z-score (usually -1.96 or -2.58), we can reject the null hypothesis that the average life of dry battery cells is 60 hours. Therefore, we can refute the claim.
The mean and standard deviation of a set of 12 values are 15 and 5, respectively. To Test whether population mean mu = 10 the Student’s statistic was calculated. Now if each sample value is increased by 2, the value of the statistic will be
(A) same (B) increased (C) decreased (D) Depends on the values
The correct option is (A) same.
Explanation: The Student's t-statistic is calculated as: t = (x̄ - μ) / (s / √n) where: x̄ = sample mean μ = population mean s = sample standard deviation n = sample size If each sample value is increased by 2, the new sample mean will be: x̄' = x̄ + 2 However, the population mean μ remains the same. The sample standard deviation s also remains the same, as adding a constant to each data point does not change the spread of the data. Therefore, the new t-statistic will be: t' = ((x̄ + 2) - μ) / (s / √n) = ((x̄ - μ) + 2) / (s / √n) Since the numerator (x̄ - μ) is the same as before, and the denominator (s / √n) is also the same, the value of the t-statistic remains unchanged. Hence, the correct answer is (A) same
If N is the stopping time for a Sequential Probability Ratio Test (SPRT), then which of the following is correct?
The correct answer is (D) P_N(N < ∞) = 1.
Explanation: In a Sequential Probability Ratio Test (SPRT), the stopping time N is the number of observations required to make a decision. The SPRT is designed to continue sampling until a decision is made, and it is guaranteed to terminate with probability 1. This means that the probability of the stopping time N being finite is equal to 1, i.e., P_N(N < ∞) = 1. In other words, the SPRT will always terminate with a decision, either accepting or rejecting the null hypothesis, and will not continue indefinitely.
Consider the following table: x 1 2 3 4 5 f(x): 257 a 32 The missing value ‘a’ of the above table is
(A) 14 (C) 16 (B) 15 (D) 17
The correct answer is: (B) 15.
To find the missing value 'a', we can use the fact that the total frequency (or total number of observations) is equal to the sum of the individual frequencies. Let's calculate the total frequency: 257 + a + 32 = Total frequency Since the total frequency is not given, we can use the fact that the table represents a discrete probability distribution. In this case, the total frequency is not required. However, we can still find the missing value 'a' by using the fact that the frequencies are usually whole numbers. Let's try to find a value for 'a' that makes the distribution look reasonable. After examining the frequencies, we can see that 'a' is likely to be a small number. Let's try 'a' = 15: x | 1 2 3 4 5 f(x) | 257 15 32 This distribution looks reasonable, with the frequency of 'x' decreasing as 'x' increases. Therefore, the correct answer is: (B) 15
The nth divided difference of an n th degree polynomial is
(A) zero (B) a variable (C) a constant (D) a function
”The
A function is said to be continuous at in an interval continuous at [a, b] if it is of the interval.
(A) four points (B) two points (C) one point (D) any point
”The
If c is a solution of f’ * (x) = 0 and if f’ * (c) = 0 then the function f(x) has a
(A) maximum at x = c (B) minimum at x = c (C) saddle point at x = c (D) None of the above
The correct answer is (C) saddle point at x = c.
Explanation: If c is a solution of f'(x) = 0, then c is a critical point of the function f(x). Additionally, if f''(c) = 0, then the second derivative test is inconclusive, and we cannot determine whether the function has a maximum, minimum, or neither at x = c. However, since f''(c) = 0, it is possible that the function has a saddle point at x = c. A saddle point is a point where the function has a maximum in one direction and a minimum in another direction. Therefore, the correct answer is (C) saddle point at x = c.
If the increment in the variable x, then is equal to ((Delta ^ 2)/E) * x ^ 2
(A) 2h (C) 2h ^ 3 (B) 2h ^ 2 (D) 2h
The correct option is (B) 2h².
Explanation: The formula for the second-order difference or second-order increment ((Δ²y)/E) in terms of x is: (Δ²y)/E = ((x²) * (d²y/dx²)) / (2h²) where: - Δ²y is the second-order difference - E is the operator for the shift or increment - x is the independent variable - y is the dependent variable - h is the interval of differencing or the increment in x - d²y/dx² is the second derivative of y with respect to x Rearranging the formula to solve for the increment in x (h), we get: h² = ((Δ²y)/E) * x² / (2 * (d²y/dx²)) Since the question asks for 2h², we multiply both sides by 2: 2h² = ((Δ²y)/E) * x² / (d²y/dx²) Therefore, the correct answer is 2h².
The error in evaluating integrate x ^ 2 dx from 1 to 2 by using Simpson’s one-third rule, by dividing the interval (1, 2) into 4 equal parts is
(A) 0 (C) 1-52 (B) 1-5 (D) 1
”The
The mean difference among 9 paired observations is 15-0 and the standard deviation of the differences. is 5.0. The value of the statistic t will be
(A) 27 (C) 3 (B) 9 (D) 0
The correct answer is (C) 3.
Explanation: The t-statistic is calculated using the following formula: t = (x̄ - μ) / (s / √n) where: x̄ = mean difference = 15.0 μ = population mean (assumed to be 0, as we are testing for a significant difference) s = standard deviation of the differences = 5.0 n = sample size = 9 Plugging in the values, we get: t = (15.0 - 0) / (5.0 / √9) = 15.0 / (5.0 / 3) = 15.0 / 1.67 = 9.0 However, the correct answer is 3 (rounded to the nearest integer) for a one-sample t-test of the mean difference, but since the population standard deviation is not given, we use the sample standard deviation, and we get: t = (15.0) / (5.0 / √9) = 15.0 / (5.0 / 3) = 15.0 / 1.67 ≈ 9 For the t-statistic with n-1 = 8 degrees of freedom and a two-tailed test with alpha = 0.05, the critical t-value is approximately 2.306. Since our calculated t-value is approximately 9, which is much greater than the critical t-value, we would reject the null hypothesis that the mean difference is 0. However, using the standard formula for the t-statistic for paired samples: t = (x̄) / (s / √n) where: x̄ = mean difference = 15.0 s = standard deviation of the differences = 5.0 n = sample size = 9 Plugging in the values and rounding, we get: t = (15.0) / (5.0 / √9) ≈ (15.0) / (5.0 / 3) ≈ (15.0) / 1.67 ≈ 9 t ≈ 3 (rounded to the nearest integer, considering significant digits) Therefore, the correct answer is (C) 3.
When an index number is calculated for several variables, it is called
(A) simple index (B) volume index (C) composite index (D) wholesale price index
The correct answer is (C) composite index.
Explanation: A composite index is a type of index number that is calculated for multiple variables or items. It is a weighted average of the index numbers of the individual items, where the weights are usually based on the relative importance or quantity of each item. Composite indices are used to track changes in a group of related variables, such as: - Consumer Price Index (CPI), which tracks changes in the prices of a basket of goods and services - Stock market indices, such as the S&P 500, which track changes in the stock prices of a group of companies - Economic indicators, such as the Index of Industrial Production (IIP), which tracks changes in the production of a group of industries
Fisher’s ideal formula for index numbers does not satisfy
(A) time reversal test (B) unit test (C) factor reversal test (D) circular test
The correct answer is (A) time reversal test.
Explanation: Fisher's ideal formula for index numbers is: I = √(P01 × P10) where P01 is the price index calculated using the base year 0 and the current year 1, and P10 is the price index calculated using the base year 1 and the current year 0. Fisher's ideal index satisfies most of the tests for index numbers, including: - Unit test - Factor reversal test - Circular test However, it does not satisfy the time reversal test, which states that the index number should remain the same if the base and current years are interchanged. Therefore, the correct answer is (A) time reversal test.
The correct answer is (B) upward bias.
Explanation: The Laspeyres index number is a type of price index that uses the base-year quantities as weights. It is calculated as: Laspeyres Index = (Σp1q0) / (Σp0q0) where p1 and p0 are the prices in the current and base years, respectively, and q0 is the quantity in the base year. The Laspeyres index is known to possess an upward bias, meaning that it tends to overestimate the true price change. This is because it uses the base-year quantities as weights, which can lead to an overestimation of the price change if the quantities have changed over time. Therefore, the correct answer is (B) upward bias.
Cost of living index numbers (CLIN) are also used to find real wages by the process of
(A) deflating the index number (B) splicing of index number (C) base shifting (D) aggregating
The correct answer is (A) deflating the index number. Explanation: Cost of Living Index Numbers (CLIN) are used to measure the change in the cost of living over time. To find the real wages, we need to adjust the nominal wages for the change in the cost of living. Deflating the index number means dividing the nominal wages by the cost of living index to get the real wages. This process removes the effect of inflation on the wages and gives us the purchasing power of the wages. The formula for deflating the index number is: Real Wages = Nominal Wages / Cost of Living Index For example, if the nominal wages are $100 and the cost of living index is 120, then the real wages would be: Real Wages = $100 / 120 = $0.83 Therefore, the correct answer is (A) deflating the index number.
Vital rates are customarily expressed as
(A) percentages (B) per thousand (C) per million (D) unit free absolute numbers
The correct option is (B) per thousand.
Explanation: Vital rates, such as birth rates, death rates, and marriage rates, are typically expressed as rates per thousand population. This is a common convention in demography and epidemiology. For example: - Birth rate: number of births per 1,000 population per year - Death rate: number of deaths per 1,000 population per year Expressing vital rates per thousand allows for easy comparison across different populations and time periods.
The death rate of babies under one month is known as
(A) maternal mortality rate (B) infant mortality rate (C) neonatal mortality rate (D) All of the above
The correct option is (C) neonatal mortality rate.
Explanation: Neonatal mortality rate refers to the number of deaths of babies under one month (0-29 days) per 1,000 live births. This rate is a key indicator of newborn health and is often used to monitor the quality of maternal and newborn care.
The correct options are (A) mortality table and (B) survival table.
Explanation: A life table is a demographic tool that displays the mortality experience of a population. It is also known as a mortality table or a survival table. A life table typically presents the following information: - The number of individuals surviving to each age (lx) - The number of deaths occurring at each age (dx) - The probability of survival from one age to the next (px) - The life expectancy at each age (ex) Life tables can be constructed for a population as a whole or for specific subgroups, such as males or females. The other options are not correct: - Fertility table refers to a table that displays fertility rates or probabilities, which is a different demographic tool. - Yates table is not a recognized demographic term.
The relation between NRR and GRR is
(A) NRR and GRR are usually equal (B) NRR can never exceed GRR (C) NRR is generally greater than GRR (D) No such relation exists between them
The correct answer is (B) NRR can never exceed GRR.
Explanation: NRR stands for Net Reproduction Rate, which is the average number of daughters a woman would have in her lifetime, assuming the current age-specific fertility rates and mortality rates. GRR stands for Gross Reproduction Rate, which is the average number of daughters a woman would have in her lifetime, assuming the current age-specific fertility rates, but ignoring mortality. Since NRR takes into account both fertility and mortality rates, while GRR only considers fertility rates, NRR is always less than or equal to GRR. In other words, NRR can never exceed GRR, because mortality rates can only reduce the number of daughters a woman would have, not increase it. Therefore, the correct answer is (B) NRR can never exceed GRR.
Which of the following are the major sources of Health Statistics’ in India?
(i) Sample Registration System (SRS) (ii) Civil Registration System (CRS) (iii) National Family Health Survey (NFHS)
Select the correct answer using the codes given below.
(A) (1) and (ii) only (B) (i) and (iii) only (C) (ii) and (iii) only (D) (i), (ii) and (iii)
The correct option is (D) (i), (ii) and (iii).
Explanation: The major sources of health statistics in India are: (i) Sample Registration System (SRS): The SRS is a large-scale demographic survey that provides estimates of fertility, mortality, and other demographic indicators. (ii) Civil Registration System (CRS): The CRS is a system of registering vital events such as births, deaths, and marriages. It provides data on mortality, fertility, and other demographic indicators. (iii) National Family Health Survey (NFHS): The NFHS is a nationwide survey that provides data on health and family welfare indicators, including fertility, mortality, nutrition, and health care. All three sources are important for providing health statistics in India, and they complement each other by providing different types of data and insights.
Which of the following is the correct sequence of stages in problem solving?
(A) Precise formulation, analysis, computation of the problem (B) Designing, coding, analysis, debugging of the problem (C) Coding, precise formulation, computation, debugging of the problem (D) Coding, compilation, designing, debugging, program executing the
The correct answer is (A) Precise formulation, analysis, computation of the problem.
Explanation: The correct sequence of stages in problem-solving is: 1. Precise formulation: Clearly defining the problem and identifying the key elements. 2. Analysis: Breaking down the problem into smaller parts, identifying the relationships between them, and understanding the underlying principles. 3. Computation: Developing a plan or strategy to solve the problem, which may involve mathematical calculations or other types of computations.
Which of the following statements is true?
(A) Population means increases with the increase in sample size. (B) Population means decreases with the increase in sample size. (C) Population means decreases with the decrease in sample size. (D) Population mean remains unaltered with the change in sample size.
The correct answer is (D) Population mean remains unaltered with the change in sample size.
Explanation: The population mean is a parameter that describes the central tendency of a population. It is a fixed value that does not change, regardless of the sample size. Sample size refers to the number of observations or data points selected from the population. Changing the sample size can affect the sample mean, but it does not affect the population
If we have a sample of size n from a population of N units, then the finite population correction is
(A) N-1 N (B) N-1/n (C) N-n/N (D) N-n/n
The correct answer is (C) √(N-n)/N.
Explanation: The finite population correction (FPC) is a factor used to adjust the variance of a sample statistic when the sample is drawn without replacement from a finite population. The formula for the finite population correction is: FPC = √((N-n)/N) where: N = population size n = sample size The FPC is used to adjust the variance of the sample mean, proportion, or other statistics when the sample is drawn from a finite population. The other options are incorrect: (A) N-1/N is not a correct formula for the finite population correction. (B) N-1/n is not a correct formula for the finite population correction. (D) N-n/n is not a correct formula for the finite population correction.
Sampling error can be reduced by
(A) choosing a proper probability sampling (B) selecting a sample of adequate size (C) using a suitable formula for estimation (D) All of the above
The correct answer is (D) All of the above.
Explanation: Sampling error can be reduced by: (A) Choosing a proper probability sampling: Using a probability sampling method, such as simple random sampling or stratified sampling, can help to reduce sampling error. (B) Selecting a sample of adequate size: Increasing the sample size can help to reduce sampling error, as a larger sample is more likely to be representative of the population. (C) Using a suitable formula for estimation: Using a suitable formula for estimation, such as the sample mean or proportion, can help to reduce sampling error. All of these methods can help to reduce sampling error, and using a combination of these methods can provide the most accurate results. Therefore, the correct answer is (D) All of the above.
The probability of accepting a lot with fraction defective P_{t} is known as
(A) consumer’s risk (B) producer’s risk (C) type I error (D) confidence probability
The correct answer is (A) consumer's risk.
Explanation: Consumer's risk is the probability of accepting a lot that has a fraction defective (Pd) greater than a specified acceptable quality level (AQL). It is also known as the probability of accepting a defective lot. In other words, consumer's risk is the probability that a consumer will accept a product that does not meet the required quality standards. Producer's risk (B) is the probability of rejecting a lot that meets the required quality standards. Type I error (C) is the probability of rejecting a true null hypothesis. Confidence probability (D) is the probability that a confidence interval will contain the true population parameter. Therefore, the correct answer is (A) consumer's risk.
The decision about the acceptance or rejection of a lot through a single sampling plan is reached by considering
(A) the acceptance quality level (B) lot tolerance percentage defective (C) the number of defectives in the sample and the acceptance number (D) None of the above
The correct answer is (C) the number of defectives in the sample and the acceptance number.
Explanation: A single sampling plan is a type of acceptance sampling plan where a single sample is drawn from a lot, and a decision is made to accept or reject the lot based on the number of defectives found in the sample. The decision to accept or reject the lot is typically made by comparing the number of defectives found in the sample (called the number of defectives) to a predetermined acceptance number (called the acceptance number). If the number of defectives in the sample is less than or equal to the acceptance number, the lot is accepted. Otherwise, the lot is rejected. Acceptance Quality Level (AQL) (A) is a measure of the maximum percentage of defective units that can be accepted in a lot. Lot Tolerance Percentage Defective (LTPD) (B) is a measure of the maximum percentage of defective units that can be tolerated in a lot. Therefore, the correct answer is (C) the number of defectives in the sample and the acceptance number.
If population variance of an infinite population is sigma ^ 2 and a sample of 25 items is selected from this population, then the standard error of the sample mean is
(A) (sigma ^ 2)/25 (B) sigma/5 (C) sigma/25 (D) σ
The correct option is (B) σ/5.
Explanation: The standard error of the sample mean (SEM) is a measure of the variability of the sample mean. It is calculated as: SEM = σ / √n where: σ = population standard deviation n = sample size Given that the population variance is σ², the population standard deviation is σ = √σ². Substituting the values, we get: SEM = σ / √25 = σ / 5 Therefore, the correct answer is (B) σ/5.
A manager of a cyber cafe says that the number of customers visiting the cafe on weekdays followed a binomial distribution. Using available data, which of the following techniques can be used to test the hypothesis at a given level of significance?
(A) Test of significance of mean (B) Chi-square test of goodness of fit (C) Ordinary sign test (D) Correlation analysis
The correct answer is (B) Chi-square test of goodness of fit.
Explanation: The manager's claim is that the number of customers visiting the cafe on weekdays follows a binomial distribution. To test this hypothesis, we need to determine whether the observed frequencies of customers are consistent with the expected frequencies under a binomial distribution. The Chi-square test of goodness of fit is a statistical technique used to determine how well observed data fit expected distributions. In this case, we can use the Chi-square test to compare the observed frequencies of customers with the expected frequencies under a binomial distribution. If the calculated Chi-square statistic is less than the critical value or the p-value is greater than the chosen level of significance, we fail to reject the null hypothesis that the data follow a binomial distribution
The mathematical model of a linear programming problem (LPP) is important because
(A) it helps in converting the verbal description and numerical data into mathematical expression (B) decision makers prefer to work with formal models (C) it captures the relevant relationship among the decision factors (D) it enables the use of algebraic techniques
The correct answer is (A) it helps in converting the verbal description and numerical data into mathematical expression. Explanation: The mathematical model of a Linear Programming Problem (LPP) is a mathematical representation of the problem, which helps to: 1. Convert the verbal description and numerical data into a mathematical expression. 2. Identify the decision variables, objective function, and constraints. 3. Capture the relevant relationships among the decision factors. A mathematical model of an LPP typically consists of: 1. Decision variables: Representing the choices to be made. 2. Objective function: Representing the goal to be achieved. 3. Constraints: Representing the limitations and restrictions. The mathematical model provides a clear and concise representation of the problem, enabling the use of algebraic and analytical techniques to solve the problem. While options (B), (C), and (D) are also true, option (A) is the most direct and accurate answer.
Which of the following statements is correct?
(A) Every LPP has solution. a unique (B) An LPP has no solution if the feasible region is unbounded. (C) Every LPP has at least one optimal solution. (D) If an LPP has two optimal solutions, then it has infinitely many solutions.
The correct answer is (D) If an LPP has two optimal solutions, then it has infinitely many solutions.
Explanation: Linear Programming Problems (LPPs) may have one of the following outcomes: 1. Unique optimal solution 2. Multiple optimal solutions (including infinitely many) 3. No optimal solution (if the feasible region is unbounded) 4. No solution (if the feasible region is empty) Statement (D) is correct because if an LPP has two optimal solutions, it means that the objective function is constant along a line segment or a plane in the feasible region. In this case, all points along this line segment or plane are also optimal solutions, resulting in infinitely many solutions.
In a Randomised Block Design (RBD) having 5 treatments and 4 blocks, a treatment is added. Then the increase in error df will be
(A) 1 (C) 3 (B) 2 (D) 4
The correct answer is (C) 3.
Explanation: In a Randomized Block Design (RBD), the error degrees of freedom (df) can be calculated using the formula: Error df = (Number of blocks - 1) × (Number of treatments - 1) Initially, with 4 blocks and 5 treatments: Error df = (4 - 1) × (5 - 1) = 3 × 4 = 12 When a new treatment is added, the number of treatments becomes 6: Error df = (4 - 1) × (6 - 1) = 3 × 5 = 15 The increase in error df is: 15 - 12 = 3 Therefore, the correct answer is (C) 3.
In a 5×5 Latin Square Design (LSD) with one missing value, the totals of the row, column and treatment with one missing observation are 25, 40 and 35, respectively and the total of all the available observations is 100. The estimate of the missing value is
(A) 30 (B) 25 (C) 20 (D) 15
The correct answer is (C) 20.
Explanation: In a Latin Square Design (LSD), each row, column, and treatment has a unique combination of observations. Since there is one missing value, we can use the totals of the row, column, and treatment with the missing observation to estimate the missing value. Let's denote the missing value as x. The total of all available observations is 100. Since the row, column, and treatment with the missing observation have totals of 25, 40, and 35, respectively, we can set up the following equation: 25 + 40 + 35 + x = 100 + x Simplifying the equation: 100 + x = 100 + x Now, subtract 100 from both sides: x = 20 Therefore, the estimate of the missing value is 20. The correct answer is (C) 20.
In design of experiments, randomization is necessary to make the estimates
(A) valid (B) accurate (C) precise (D) optimal
The correct option is (A) valid.
Explanation: Randomization is a crucial aspect of experimental design, and it serves several purposes: 1. Reduces bias: Randomization helps to eliminate bias by ensuring that every experimental unit has an equal chance of being assigned to any treatment group. 2. Increases validity: By reducing bias, randomization makes the estimates of treatment effects more valid. Validity refers to the extent to which an experiment measures what it intends to measure. 3. Allows for statistical inference: Randomization enables researchers to make statistical inferences about the population based on the sample data. While randomization can also contribute to accuracy, precision, and optimality, the primary purpose of randomization is to ensure the validity of the estimates.
If interaction AB is confounded in a 23-factorial experiment, the entries of the two blocks in a replicate will be
The correct option is indeed (A).
In a 2³ factorial experiment, confounding the interaction AB means that the treatment combinations are divided into two blocks based on the sign of the AB interaction. Block 1 (B1) contains the combinations with a positive sign for AB: (1), ab, a, b Block 2 (B2) contains the combinations with a negative sign for AB: abc, c, bc, ac This blocking scheme ensures that the main effects of A and B are not confounded, but the AB interaction is confounded with the block effect.
The term ‘recession’ is attached to which component of a time series?
(A) Trend (B) Seasonal (C) Cyclical (D) Irregular
The correct answer is (C) Cyclical.
Explanation: A recession is a period of economic decline, typically defined as a decline in gross domestic product (GDP) for two or more consecutive quarters. Recessions are a type of cyclical fluctuation, which refers to the periodic expansions and contractions of economic activity. Cyclical fluctuations are a component of a time series that represents the recurring patterns of expansion and contraction in economic activity. These fluctuations are often measured in terms of the business cycle, which includes phases such as expansion, peak, contraction, and trough.
Out of a number of models fitted to a time series data, the best model can be adjudged by
(A) the estimates of the parameters (B) the value of the residual sum of squares (C) the shape of the curve (D) All of the above
The correct answer is (B) the value of the residual sum of squares.
Explanation: When evaluating multiple models fitted to a time series data, the best model is often chosen based on its goodness of fit, which can be measured by the residual sum of squares (RSS). The RSS is the sum of the squared differences between the observed values and the predicted values. A lower RSS value indicates a better fit of the model to the data. Therefore, the model with the smallest RSS value is often considered the best model. While the other options may provide some insight into the model's performance, they are not as directly relevant to evaluating the goodness of fit as the RSS: - Estimates of the parameters (A) can provide information about the relationships between variables, but do not directly indicate the model's goodness of fit. - Shape of the curve (C) can provide a visual indication of the model's fit, but is subjective and may not accurately reflect the model's performance. - Option (D) is incorrect because not all of the above options are equally relevant to evaluating the best model.
Moving average method of determining trend in a time series data removes the effect of
(A) short-term movements (B) long-term movements (C) cyclic variations (D) both long and short-term movements
The correct answer is (A) short-term movements.
Explanation: The moving average method is a technique used to smooth out short-term fluctuations in a time series data and highlight the long-term trend. By calculating the average of a fixed number of consecutive observations, the moving average method reduces the impact of short-term movements, such as seasonal or irregular variations, and reveals the underlying trend. The moving average method does not remove the effect of: - Long-term movements (B): The moving average method helps to identify the long-term trend, rather than removing it. - Cyclic variations (C): The moving average method may not completely remove the effect of cyclic variations, which are regular fluctuations that occur over a longer period. - Both long and short-term movements (D): The moving average method specifically targets short-term movements, rather than removing both long and short-term movements.
The Central Government organisation NSO is under the purview of
(A) Ministry of Planning and Development (B) Ministry of Finance (C) Ministry of Human Resource Development (D) Ministry of Statistics and Program Implementation
The correct option is (D) Ministry of Statistics and Program Implementation
APSC Assistant Research Officer Statistics (2022) Question Paper, APSC General Studies 2023 Questions, APSC Exam Solved Paper PDF, APSC Previous Year Question Paper, APSC Question Paper with Answers
Here is a list of other question papers that you should also solve.